

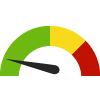
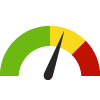
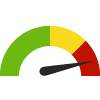
Red is bad, green is good, blue is not statistically different/neutral.
 the value is in the best half of communities.
 the value is in the 2nd worst quarter of communities.
 the value is in the worst quarter of communities.
 meets target;
  does not meet target.
 lower than the comparison value;
 higher than the comparison value;
 not statistically different from comparison value.

 non-significant change over time;
 significant change over time;
  no change over time.
 higher than the previous measurement period;
 lower than the previous measurement period;
 no statistically different change from previous measurement period.
 Significantly better than the overall value
 Significantly worse than the overall value
 No significant difference with the overall value
 No data on significance available
This indicator is archived and is no longer being updated. Click to learn more
Child abuse includes abuse or neglect of a child under the age of 18 by a parent, caregiver, or another person in a custodial role (e.g., a religious leader, a coach, or a teacher) that results in harm, the potential for harm, or threat of harm to a child. It includes physical abuse, sexual abuse, emotional abuse, and neglect. At least one in seven children experienced child abuse or neglect in the past year in the United States, though this is likely an underestimate as many cases remain unreported. Children who are abused or neglected may suffer immediate and long-term physical, emotional, and psychological problems (Centers for Disease Control and Prevention).
Considerations for Equitable Approaches: Rates of child abuse and neglect are higher for children in families with low socioeconomic status compared to families with a higher socioeconomic status. Experiencing poverty can place a lot of stress on families, which may increase the risk for child abuse and neglect (Centers for Disease Control and Prevention). Children younger than four years and children with special needs that may increase caregiver burden (such as disabilities or mental health issues) are more likely to be at risk for abuse (Centers for Disease Control and Prevention). Strategies to prevent child abuse and neglect include strengthening economic supports to families, changing social norms to support positive parenting, providing quality care and education early in life, enhancing parenting skills, and intervening to lessen harms (Centers for Disease Control and Prevention).
Inclusive Language Recommendations: Recommendations for more inclusive language include utilizing person-first language such as “survivor of” rather than “victim of” child abuse, which can dehumanize those who are being referred to (Centers for Disease Control and Prevention).
Filed under: Community / Social Environment, Health / Children's Health, Community / Domestic Violence & Abuse, Social Determinants of Health, Children